2021 elderly poverty statistics
How economic problems affect seniors

According to the most recent studies, in the United States:
- More than 15 million older adults are economically insecure.
- About 50% of seniors rely on Social Security for the majority of their income.
- Over the next 10 years, the number of elderly Americans without homes could triple.
Poverty affects older adults differently than other demographics — these individuals are especially vulnerable to economic instability when their physical health, cognitive abilities and social networks decline.
Poverty by age group in 2020
The Center on Poverty and Social Policy at Columbia University estimates that 8 million Americans slipped into poverty during the coronavirus pandemic.
Poverty rates for adults over the age of 65 were the most unchanged across age demographics. This is likely due to the number of people in this demographic who rely on retirement income and Social Security instead of wages.
- The monthly poverty rate for older adults increased from 15.7% in January to 16% in September, a less significant change than with other demographics.
- The monthly poverty rate for adults ages 18 to 64 increased from 14.3% to 15.5%.
- The monthly poverty rate for children increased from 18.7% to 20.4%.
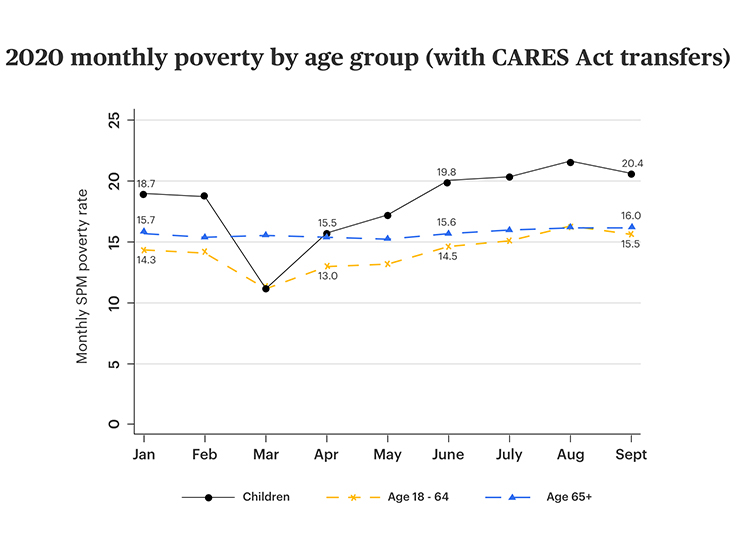
Source: Center on Poverty & Social Policy, School of Social Work, Columbia University, “Monthly Poverty Rates in the United States during the COVID-19 Pandemic.” October 15, 2020. Accessed April 5, 2021.
Elderly poverty rates by age and gender
According to the Federation of American Scientists, women 80 and older had the highest poverty rate among all senior age groups in 2017 — 13.5%. Older women are more likely to live in poverty than men as a result of wage discrimination and having to take time out of the workforce for caregiving.
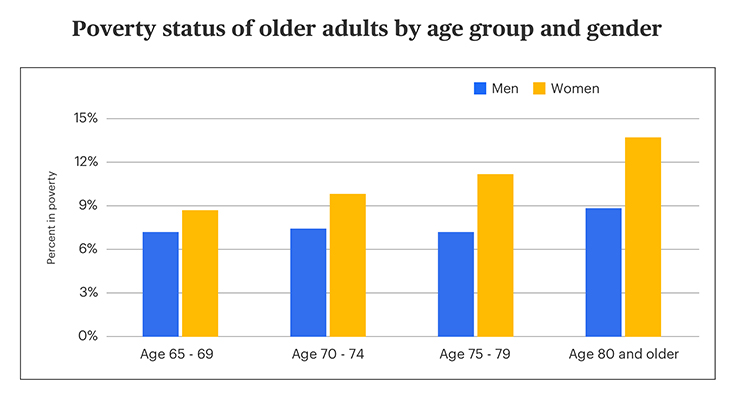
Source: Federation of American Scientists (FAS), “Poverty Among Americans Aged 65 and Older.” Accessed April 5, 2021.
Elderly poverty by age group over time
Among older people, those over 80 are most likely to live in poverty (as of 2017). In addition to age and gender, marital status also plays a part in elderly poverty. Both men and women 65 and older who are married and living with a spouse are less likely to be poor than those who are not married. Nearly 19% of women over 80 who live alone are in poverty. Poverty rates are higher among never-married men, at 22.5%.
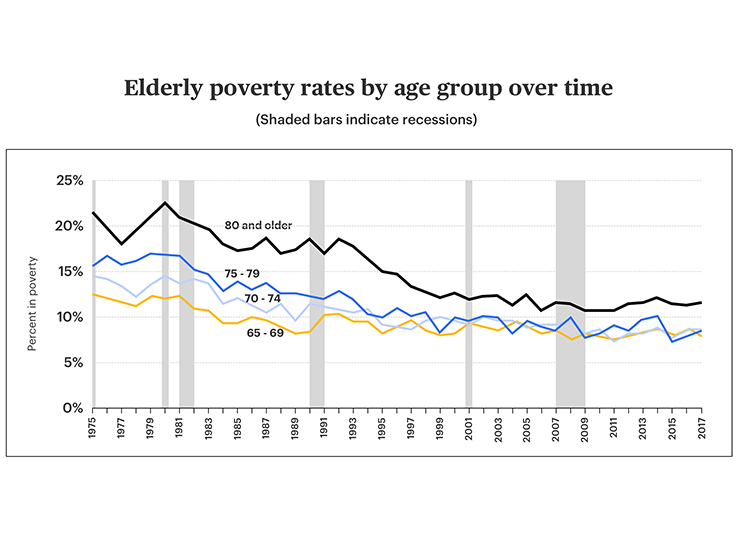
Source: Congressional Research Service, “Poverty Among Americans Aged 65 and Older.” Accessed April 5, 2021
Planning for elder care is important. Otherwise, you might underestimate how much you need to retire. For more information, read about the costs of aging in place, nursing home costs in 2021 and different types of senior living next.
Impact of health status on poverty rates
The majority of older adults are in fair or poor health and have incomes below the poverty level. Those living in poverty are less likely to have adequate resources for food, housing, health care and other significant needs, which can in turn affect physical and mental health.
Adults 65 and older account for 16% of the U.S. population but 80% of coronavirus deaths in the U.S. This is higher than their share of deaths from all other causes (75%) over the same time period.
- In 2019, nearly 6 in 10 older adults considered to be in fair or poor health had incomes below 200% of the poverty level, compared with about 3 in 10 older adults in good or excellent health.
- As of late 2020, 95% of Americans killed by COVID-19 were 50 or older, with the odds getting worse as people age — a plurality of covid deaths occurred in those over 85.
- Nearly 1 in 10 households that include Americans 65 or older can't buy enough food — this is more than during the Great Recession from 2007 to 2009.
In the beginning of the coronavirus pandemic, seniors experienced increased food insecurity. This could be due to fewer in-person visits from friends and family members or less involvement with community outreach programs.
For more information, read about Medicare vs. Medicaid, Medicare supplemental insurance or long-term care insurance next.
Senior poverty rates over time
Each year, Social Security benefits lift more Americans out of poverty than any other program. Over 14.8 million elderly adults are lifted out of poverty by obtaining Social Security benefits.
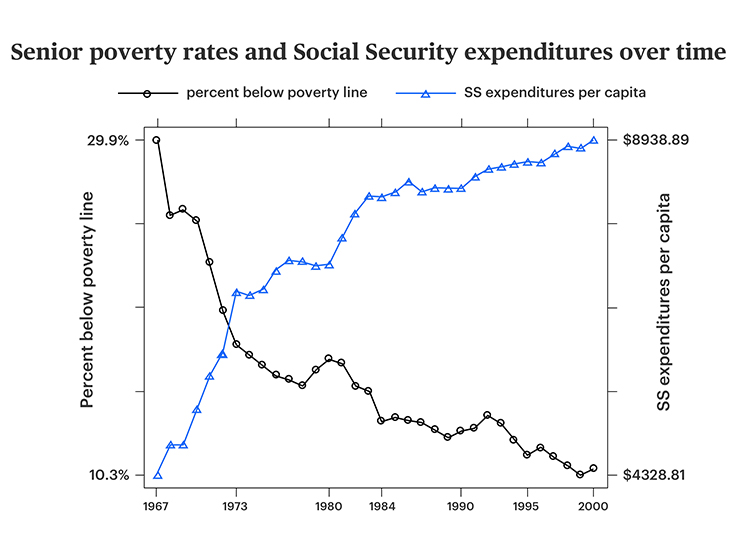
Source: National Bureau of Economic Research, “Social Security and the Evolution of Elderly Poverty.” Accessed April 5, 2021.
Social Security and poverty predictions
Americans are living longer — and, at the same time, the birth rate is decreasing. For several years now, we’ve been in the middle of a “silver tsunami” caused by 10,000 baby boomers turning 65 each day. In addition, those in Generation X will start turning 65 by 2030.
According to the Social Security Administration, Social Security is not sustainable over the long term with the current benefits and tax rates.
- The number of retired workers is expected to double in about 50 years.
- Both Old-Age and Survivors Insurance (OASI) and Disability Insurance (DI) reserves will be depleted by 2035.
Elderly homelessness on the rise
Older people have the highest risk of putting more than 30% of their incomes toward rent or mortgage payments, according to the Harvard Joint Center for Housing Studies.
- New York City’s over-50 homeless population is projected to reach 25,000 by 2030.
- Another 2.4 million of the poorest seniors will lose access to affordable housing by 2038.
Understanding poverty statistics
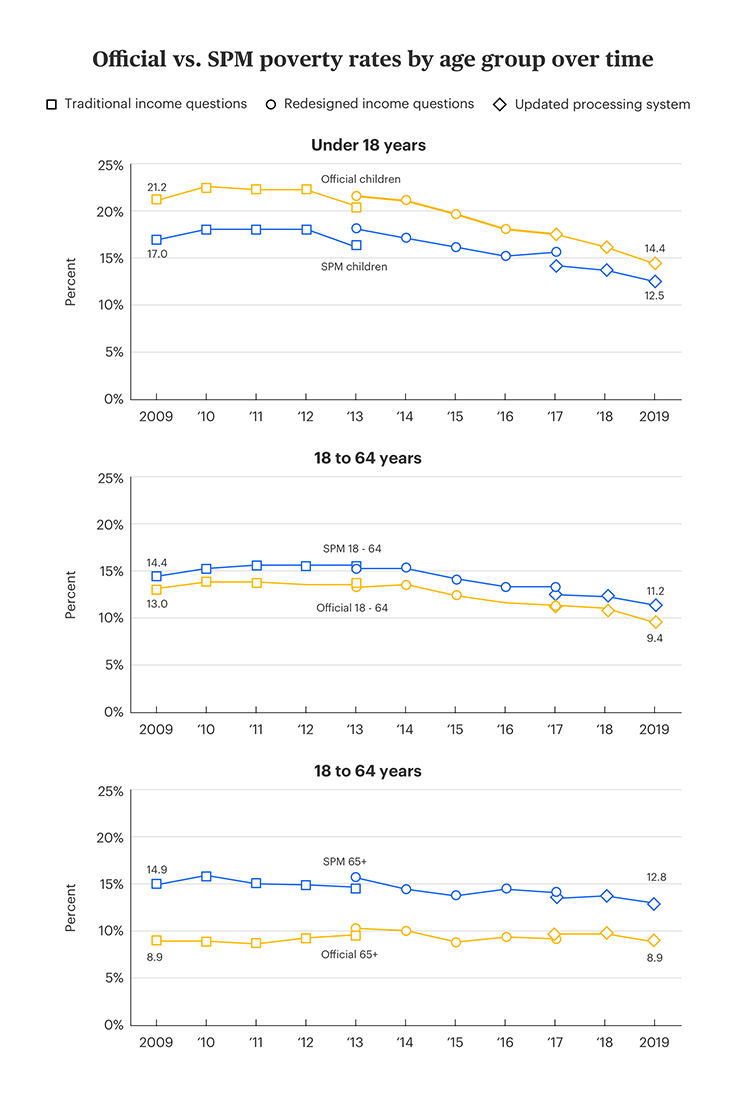
The official poverty measure is just one way to evaluate economic well-being. Since 2011, the U.S. Census Bureau has reported on the Supplemental Poverty Measure (SPM) with support from the Bureau of Labor Statistics (BLS).
SPM extends the original measure by also taking into consideration government programs and geographic differences in the cost of living. Currently, the most important distinguishing factor between this and the original poverty measure is that SPM factors in the cost for out-of-pocket medical expenses.
As of 2020, 8.9% of people ages 65 and older have incomes below the official poverty threshold under the official poverty measure. However, this number increases to 12.8% based on the SPM poverty thresholds.
It’s important to note that poverty status is not measured for institutionalized populations, including those in nursing facilities, prisons or military bases.
Source: Social Security Administration, “The Supplemental Poverty Measure (SPM) and the Aged: How and Why the SPM and Official Poverty Estimates Differ.” Accessed April 5, 2021.
A brief history of Social Security
President Franklin Delano Roosevelt signed the Social Security Act into law on August 14, 1935, instituting a social insurance program to provide those 65 and older with a post-retirement income. Today, the Social Security Administration administers retirement benefits, disability benefits, benefits for surviving spouses and children of working family members and Supplemental Security Income.
We put those payroll contributions there so as to give the contributors a legal, moral and political right to collect their pensions and their unemployment benefits. With those taxes in there, no damn politician can ever scrap my Social Security program.”
Historically, older Americans have been at higher risk of economic instability. For most of the 20th century, the percent of all people below the poverty line has decreased inversely with the rise in Social Security expenditures.
- Article sources
- ConsumerAffairs writers primarily rely on government data, industry experts and original research from other reputable publications to inform their work. Specific sources for this article include:
- National Council on Aging (NCOA), “Get the Facts on Economic Security for Seniors.” Accessed April 5, 2021.
- Center on Budget and Policy Priorities (CBPP), “Policy Basics: Top Ten Facts about Social Security.” Accessed April 5, 2021.
- The New York Times Magazine, “Elderly and Homeless: America’s Next Housing Crisis.” Accessed April 5, 2021.
- Center of Poverty & Social Policy, Columbia University, “Monthly Poverty Rates in the United States during the COVID-19 Pandemic.” Accessed April 5, 2021.
- Center on Budget and Policy Priorities (CBPP), “Social Security Lifts More Americans Above Poverty Than Any Other Program.” Accessed April 5, 2021.
- The Senior Citizens League, “Social Security Benefits Lose 30% of Buying Power Since 2000: No COLA Likely for 2021.” Accessed April 5, 2021.
- Social Security Administration, “Cost-of-Living Adjustment (COLA) Information for 2021.” Accessed April 5, 2021.
- Justice in Aging, “Older Women & Poverty: Special Report, December 2018.” Accessed April 5, 2021.
- Federation of American Scientists (FAS), “Poverty Among Americans Aged 65 and Older.” Accessed April 5, 2021.
- Kaiser Family Foundation, “What Share of People Who Have Died of COVID-19 Are 65 and Older – and How Does It Vary By State?” Accessed April 5, 2021.
- Brookings, “For Millions of Low-income Seniors, Coronavirus Is a Food-security Issue.” Accessed April 5, 2021.
- AARP, “95 Percent of Americans Killed by COVID-19 Were 50 or Older.” Accessed April 5, 2021.
- Center on Budget and Policy Priorities (CBPP), “SNAP Helps Millions of Low-income Seniors.” Accessed April 5, 2021.
- Centers for Disease Control and Prevention, “Identifying Vulnerable Older Adults and Legal Options for Increasing Their Protection During All-Hazards Emergencies.” Accessed April 5, 2021.
- United States Census Bureau, “2020 Census Will Help Policymakers Prepare for the Incoming Wave of Aging Boomers.” Accessed April 5, 2021.
- Social Security Administration, “The Long-Run Financial Outlook.” Accessed April 5, 2021.
- Social Security Administration, “A Summary of the 2020 Annual Reports.” Accessed April 5, 2021.
- American Society on Aging, “Homelessness Among Older Adults: An Emerging Crisis.” Accessed April 5, 2021.
- Social Security Administration, “The Supplemental Poverty Measure (SPM) and the Aged: How and Why the SPM and Official Poverty Estimates Differ.” Accessed April 5, 2021.
- Social Security Administration, “Monthly Statistical Snapshot, September 2019 - February 2020; September 2020 - February 2021.” Accessed April 5, 2021.
- Congressional Research Service, “Poverty Among Americans Aged 65 and Older.” Accessed April 5, 2021.
- National Bureau of Economic Research (NBER), “Social Security and the Evolution of Elderly Poverty.” Accessed April 5, 2021.
- U.S. Census Bureau, “Current Population Survey, 2010 to 2020 Annual Social and Economic Supplements.” Accessed April 5, 2021.
- U.S. Department of Health & Human Services, “2021 Poverty Guidelines.” Accessed April 5, 2021.
You’re signed up
We’ll start sending you the news you need delivered straight to you. We value your privacy. Unsubscribe easily.
Current Social Security trends
It appears that more retired people are collecting Social Security benefits now than they were last year. Though the COVID-19 pandemic has had a deadly impact on adults over 65, it's hard to say what this means just yet.
“It is still too early for our data to have an indication of COVID effects,” according to Darren Lutz, a representative of the Social Security Administration’s Press Office. “The snapshot tables on our website will be updated this year, but the update will still not capture the effects of the pandemic.”
Source: Social Security Administration, “Monthly Statistical Snapshot, September 2019 - February 2020; September 2020 - February 2021.” Accessed April 5, 2021.