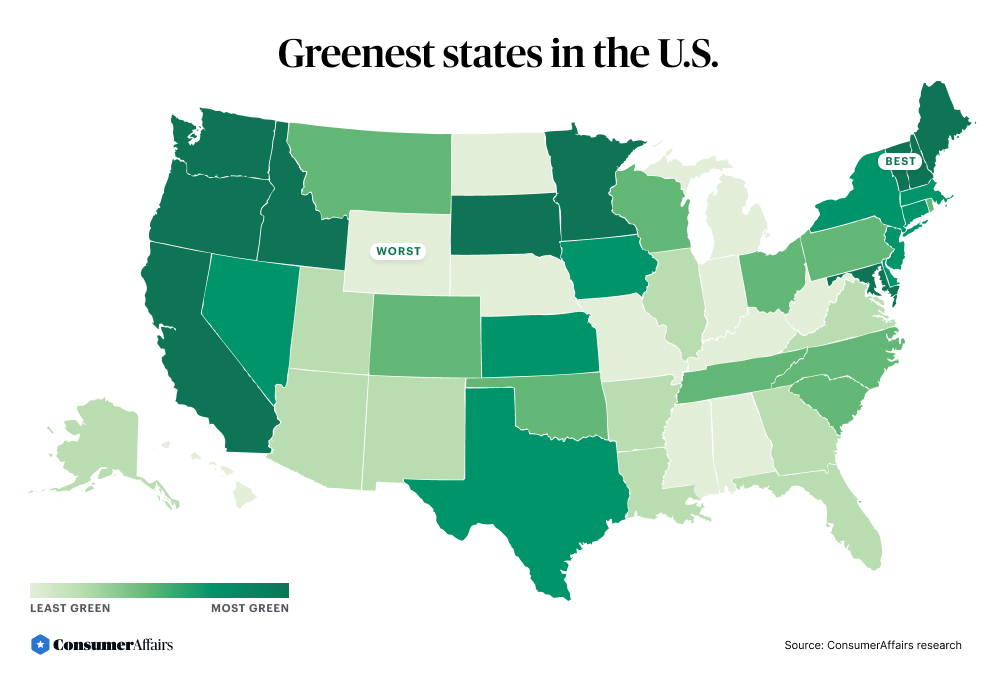
Greenest states in the U.S.
Vermont is the most environmentally friendly in 2023

We're at a critical turning point in climate change. It’s a reality impacting our economy, health and overall quality of life.
From 2020 to 2022, the National Centers for Environmental Information recorded 60 weather and climate disasters resulting in 1,460 deaths and losses of over $447 billion. In the entire decade of the 1980s, NCEI confirmed only 33 events, leading to 2,994 deaths and losses of $210 billion.
Lawmakers in almost every state recognize the need to shift from fossil fuels to renewable energy sources to reduce carbon emissions. Federal incentives supported by the Inflation Reduction Act have enabled them to embrace renewable technologies and reevaluate their energy infrastructure, but not all states share the same level of urgency.
The ConsumerAffairs Research Team ranked states on their eco-friendliness based on factors like renewable energy generation, greenhouse gas emissions, waste generation and recycling practices. Read our full methodology for more details on how we ranked each state.
Here are some of the key takeaways:
- Annual total renewables net generation: Texas leads the nation, generating 116,574,869 megawatt-hours (MWh) of net renewable energy in 2021, while Maine generated the highest percentage of energy from renewables (66.1%).
- Emissions per capita: Vermont has the lowest, at 0.06 tons of greenhouse gas emissions per person in 2021. Wyoming has the highest, at 68.55.
- Percentage of waste recycled: Maine recycles nearly 48% of all waste, more than any other state and 95 times the percentage in Louisiana, the state that recycles the least (0.5%).
The greenest states
We ranked all 50 states based on eco-friendliness. Here are the top five, with a breakdown of their clean energy incentives and initiatives.
To find out which states are doing the most to combat the climate crisis, the ConsumerAffairs Research Team aggregated the latest publicly available data to analyze each state’s greenhouse gas emissions, waste, recycling, composting and energy generation from renewable and nuclear sources.
1. Vermont
The Green Mountain State lives up to its name in 2023. Vermont has the lowest emissions per capita, and nearly 100% of electricity comes from renewable energy sources — more than any other state can claim.
“Our economy is very tied to natural resources, from our seasonal recreation businesses to farming, and there seems to be a prevailing sense that those resources require some protection,” said Jennifer Rushlow, dean of Vermont School for the Environment at Vermont Law and Graduate School.
Vermonters do have a reputation for being environmentally friendly, and it’s true they recycle more than average. “But at the political level, it is more complicated,” Rushlow said.
The biggest news coming out of Vermont is the recent passage of the Affordable Heat Act, which aims to expand access to cleaner, cheaper heat. Most heating energy comes from fossil fuels, according to the Vermont Natural Resources Council — this new clean heat standard aims to reduce these emissions, according to Rushlow.
What makes Vermont the greenest state?
- Generated 99.7% of its energy from renewable resources in 2021, by far the most in the U.S.
- Produced only 0.06 tons of carbon dioxide equivalent (CO2e) per capita in 2021, the least in the U.S.
- Recorded the second-lowest amount of waste per capita (0.86 tons)
2. Washington
Despite Washington’s reputation for cloudy skies, it has ample solar incentives, including tax credits and net metering.
A Friday Harbor resident told ConsumerAffairs they “invested in a solar energy system for our home because of environmental and utility cost benefits.” They took advantage of the 30% federal solar tax credit and told us, “OPALCO (Orcas Power & Light Cooperative) supports net metering, so we now offset 100% of our yearly electric-grid consumption.”
» MORE: How much do solar panels cost?
In related news, Washington’s last coal-fired power plant, in the city of Centralia, will close in 2025. The power plant’s closure is a step toward a fully green electricity grid, according to The Seattle Times: “The new technologies may provide a way for Centralia to remain a town of electricity generation, but in a greener way, and continue to fuel the state’s grid.”
What makes Washington one of the greenest states?
- Generated 74.2% of energy from renewable resources in 2021
- Produced the second-lowest CO2e emissions rate in 2021, at 203 pounds of greenhouse gases per MWh
- Registered the best recycle-plus-compost score — two times better than the national average
3. Oregon
Oregon has one of the lower per-capita carbon footprints in the country. Nearly two-thirds (65%) of its energy generation in 2021 was renewable, and its residents do much better than the national average when it comes to recycling, composting and producing low amounts of waste.
Oregon’s Renewable Portfolio Standard requires that 50% of the state's electricity use come from renewable resources by 2040, so there are plenty of tax credits and incentives to go solar. Depending on your income, rebates cover up to 40% to 60% of the net cost to install a solar electric system or paired solar and storage system.
The Oregon Department of Energy also runs programs to increase electric vehicle adoption, promote energy efficiency at home and fight climate change.
What makes Oregon one of the greenest states?
- Generated 39,684,360 MWh of energy (65% of its total) from renewable resources in 2021
- Emissions per capita were less than 50% of the national average in 2021
- Recycling rate (36.5%) was about two times the national average
4. Maine
Maine wins in terms of recycling. It also has the second-lowest amount of landfill waste of all states. The state is on track to get 100% of its electricity from renewable power sources by 2040, according to the Portland Press Herald.
The Natural Resources Council of Maine advocates for policies to improve air quality and reduce pollution throughout the state. In 2021, Maine became the very first state to pass a law that charges corporations for recycling consumer packaging and disposing of nonrecyclable packaging.
For homeowners, Efficiency Maine, an independent, quasi-state agency, offers loans up to $7,500 with a 5.99% annual percentage rate (APR) to pay for energy upgrades.
What makes Maine one of the greenest states?
- Recycled 47.7% of municipal solid waste, more than any other state
- Produced 1.18 tons of CO2e per capita in 2021 — the second-lowest after Vermont
- Only 15% of waste ends up in landfills (the national average is 68%)
5. South Dakota
South Dakota ranks well in all the criteria we investigated and rounds out the top five greenest states. The state generated the second-highest percentage of energy from renewables (82.7%) in 2021 and ranked fourth in CO2e emissions produced per MWh of electricity. Residents have access to energy efficiency rebate programs, tax credits and more through the South Dakota Public Utilities Commission.
Like Vermont, the state’s economy is very tied to seasonal recreation and agriculture, so there’s an urgency to protect national resources. But the politics get complicated — Dakota News Now recently reported that community organizations claimed the Sioux Falls mayor’s office gutted a new sustainability plan.
» COMPARE: Best solar energy companies
What makes South Dakota one of the greenest states?
- Generated 82.70% of its energy in 2021 from renewable resources, the second-highest total after Vermont
- Recorded the fourth-lowest CO2e emission rate (304.6 pounds per MWh) in 202, trailing only Vermont, Washington and Idaho
- Had a CO2e per capita emissions rate of 2.88 tons in 2021, 13th in the U.S.
Greenest states, ranked
ConsumerAffairs used five factors to rank the greenest states: the share of total energy production that comes from renewable energy, carbon dioxide equivalent emissions per capita, carbon dioxide equivalent produced per megawatt-hour of electricity, waste generated per capita and percentage of waste recycled or composted. Read our full methodology for more details on how we calculated individual and total scores for each state.
| Percentage of energy generation from renewables | Emissions per capita (tons of CO2e) | CO2e output emission rate (lbs./MWh) | Waste generation per capita (tons) | % of waste recycled | % of waste composted | Green score | |
|---|---|---|---|---|---|---|---|
| 1. Vermont | 99.7% | 0.06 | 44.8 | 0.86 | 22.40% | 6.80% | 65.8 |
| 2. Washington | 74.2% | 1.44 | 203.0 | 1.31 | 36.90% | 13.30% | 62.5 |
| 3. Oregon | 65.0% | 2.34 | 326.7 | 1.03 | 36.50% | 10.30% | 52.0 |
| 4. Maine | 66.1% | 1.18 | 309.4 | 1.06 | 47.70% | 3.70% | 50.6 |
| 5. South Dakota | 82.7% | 2.88 | 304.6 | 1.06 | 18.20% | 7.00% | 45.1 |
| 6. California | 41.1% | 1.21 | 480.5 | 1.78 | 41.80% | 11.50% | 38.9 |
| 7. Idaho | 70.2% | 1.18 | 272.0 | 1.16 | 8.60% | 0% | 25.7 |
| 8. Maryland | 9.5% | 2.16 | 702.0 | 1.07 | 25.50% | 13.70% | 18.8 |
| 9. New Hampshire | 14.3% | 1.87 | 308.0 | 0.87 | 40.80% | 2.10% | 18.3 |
| 10. Minnesota | 27.2% | 4.27 | 831.6 | 1.08 | 44.80% | 3.90% | 17.4 |
| 11. Iowa | 57.3% | 8.07 | 774.4 | 1.29 | 24.00% | 6.40% | 17.2 |
| 12. New York | 28.7% | 1.43 | 457.0 | 0.90 | 12.90% | 6.70% | 16.7 |
| 13. Massachusetts | 17.6% | 1.18 | 859.6 | 1.15 | 28.60% | 8.80% | 16.4 |
| 14. Delaware | 3.2% | 1.83 | 870.1 | 1.14 | 12.70% | 19.80% | 16.2 |
| 15. Kansas | 45.6% | 8.07 | 844.6 | 1.15 | 28.40% | 2.70% | 8.2 |
| 16. Texas | 24.3% | 6.85 | 860.2 | 1.24 | 8.90% | 14.80% | 7.0 |
| 17. Nevada | 30.7% | 4.69 | 716.9 | 1.50 | 28.40% | 2.10% | 4.9 |
| 18. New Jersey | 3.2% | 1.59 | 483.1 | 1.24 | 40.00% | 0.00% | 4.6 |
| 19. Connecticut | 3.4% | 3.13 | 518.1 | 0.90 | 16.60% | 8.50% | 4.6 |
| 20. North Carolina | 14.1% | 4.06 | 672.7 | 0.96 | 8.70% | 7.10% | -0.4 |
| 21. South Carolina | 6.1% | 5.27 | 570.4 | 0.96 | 21.60% | 4.00% | -3.5 |
| 22. Pennsylvania | 3.3% | 6.76 | 729.6 | 1.11 | 31.60% | 4.80% | -4.3 |
| 23. Rhode Island | 7.2% | 3.55 | 833.6 | 0.88 | 7.00% | 7.00% | -5.3 |
| 24. Tennessee | 14.4% | 3.91 | 702.6 | 1.20 | 20.00% | 1.00% | -5.6 |
| 25. Colorado | 32.7% | 5.92 | 1,224.6 | 1.60 | 21.70% | 2.20% | -6.6 |
| 26. Montana | 51.3% | 11.61 | 1,053.0 | 1.71 | 14.90% | 4.40% | -7.1 |
| 27. Wisconsin | 8.1% | 6.91 | 1,274.9 | 0.99 | 14.90% | 9.70% | -8.9 |
| 28. Oklahoma | 44.1% | 7.57 | 756.6 | 1.27 | 3.70% | 0% | -8.9 |
| 29. Ohio | 3.6% | 6.45 | 1,214.9 | 1.10 | 19.30% | 9.00% | -9.2 |
| 30. Alaska | 28.2% | 4.14 | 925.0 | 0.95 | 4.50% | 0% | -9.5 |
| 31. Illinois | 11.1% | 4.70 | 657.3 | 1.06 | 7.30% | 3.60% | -10.0 |
| 32. New Mexico | 35.7% | 9.41 | 1,140.8 | 1.16 | 14.20% | 2.80% | -10.4 |
| 33. Virginia | 7.7% | 3.21 | 601.5 | 1.92 | 18.40% | 2.60% | -10.6 |
| 34. Florida | 5.5% | 4.62 | 837.5 | 1.44 | 27.20% | 0% | -12.6 |
| 35. Georgia | 11.5% | 4.31 | 762.4 | 1.09 | 6.50% | 0.40% | -15.8 |
| 36. Arizona | 13.4% | 5.34 | 727.6 | 1.10 | 5.40% | 0.90% | -16.3 |
| 37. Utah | 12.4% | 9.82 | 1,571.2 | 0.92 | 2.20% | 11.60% | -19.0 |
| 38. Louisiana | 3.0% | 8.74 | 828.7 | 1.28 | 0.50% | 10.10% | -19.1 |
| 39. Arkansas | 8.9% | 10.90 | 1,093.1 | 1.98 | 41.70% | 1.60% | -19.9 |
| 40. Hawaii | 19.0% | 4.75 | 1,502.6 | 2.86 | 15.80% | 7.00% | -20.3 |
| 41. Nebraska | 28.7% | 10.83 | 1,133.7 | 1.40 | 13.10% | 0% | -23.3 |
| 42. Michigan | 9.5% | 5.77 | 1,010.3 | 1.39 | 6.00% | 0% | -25.8 |
| 43. Alabama | 10.7% | 10.56 | 754.5 | 1.13 | 9.00% | 0% | -27.6 |
| 44. Missouri | 11.0% | 10.19 | 1,649.0 | 0.82 | 19.60% | 0% | -29.1 |
| 45. Kentucky | 7.6% | 13.38 | 1,739.8 | 1.43 | 26.70% | 5.90% | -30.0 |
| 46. Indiana | 9.8% | 11.24 | 1,642.9 | 0.99 | 7.60% | 5.70% | -30.6 |
| 47. Mississippi | 2.6% | 9.60 | 836.4 | 0.97 | 4.60% | 0.20% | -31.6 |
| 48. North Dakota | 39.3% | 37.02 | 1,351.0 | 1.39 | 9.60% | 18.20% | -44.2 |
| 49. West Virginia | 5.1% | 36.05 | 1,959.4 | 1.16 | 16.00% | 0% | -89.7 |
| 50. Wyoming | 21.7% | 68.55 | 1,847.4 | 1.29 | 6.40% | 10.00% | -132.6 |
Bottom line
Scientists, philosophers and economists agree on the importance of reducing carbon emissions. The urgency to transition to renewables is gaining momentum nationwide, and (some) states are taking significant steps toward this charge. Federal, state and local incentives help.
But the climate crisis is a contentious issue in recent political discussions — for example, a court ruling in Montana sparked debates on climate accountability, and environmentalists in Virginia and West Virginia are likely to protest the White House in an effort to stop the Mountain Valley Pipeline.
In Vermont, Gov. Phil Scott vetoed the Affordable Heat Act, only to be overridden by state lawmakers. “Leadership in environmental protection is certainly a mixed bag in Vermont, particularly when it comes to addressing the climate crisis,” Rushlow, from Vermont Law and Graduate School, said.
Everyone can do their part — you could get solar panels or an energy-efficient mortgage and follow our tips on saving energy at home — but our future also depends in large part on our lawmakers and corporations.
Methodology
To determine the greenest states, we compared five factors and assigned scores based on their relation to the national average. The scores were given a positive or negative value based on whether the underlying factor was green (+) or not green (-). The averages for each factor are normalized as either 10 or -10.
- Renewable energy generation as a percentage of total energy generation: Data for various renewable energy types was taken from the EPA’s Emissions & Generation Resource Integrated Database (eGRID). Data is from 2021.
- Emissions per capita: Data for carbon dioxide equivalent (CO2e) generated per person in each state was also based on eGRID data from 2021. The per capita figure is measured in tons of CO2e.
- CO2e emission rate: The CO2e emission rate is in pounds of CO2e per megawatt-hour (MWh) of electricity. It comes from eGRID data from 2021.
- Waste generated per capita: We referred to solid waste generation and disposal data published in 2014 by the Earth Engineering Center at Columbia University. In some cases where data was missing, numbers were taken from earlier years. The per capita numbers are in tons per person. Data and population numbers are from 2011.
- Percentage of waste recycled or composted: Recycling and composting rates are also from the Columbia University study. Data is from 2011.
Article sources
- Environmental Protection Agency, “ eGRID with 2021 Data .” Accessed June 2, 2023.
- Columbia University Earth Engineering Center, “ Generation and Disposition of Municipal Solid Waste (MSW) in the United States — A National Survey .” Accessed June 2, 2023.
- Environmental Protection Agency, “ Climate Change Indicators: U.S. and Global Temperature .” Accessed June 2, 2023.
- Environmental Protection Agency, “ Our Nation's Air .” Accessed June 2, 2023.
- Eunomia, “ The 50 States of Recycling: A State-by-State Assessment of Containers and Packaging Recycling Rates .” Accessed June 2, 2023.
- NASA, “ Health Impacts .” Accessed June 2, 2023.
- National Oceanic and Atmospheric Administration, “ Billion-Dollar Weather and Climate Disasters .” Accessed June 2, 2023.
- Inside Climate News, “ Environmentalists in Virginia and West Virginia Regroup to Stop the Mountain Valley Pipeline, Eyeing a White House Protest .” Accessed June 2, 2023.
- Conservation Law Foundation, “ Vermont Legislature Overrides Veto of Affordable Heat Act .” Accessed June 2, 2023.
- Portland Press Herald, “ Rising power costs help fuel Gov. Mills’ plan to speed transition to renewable electricity .” Accessed June 2, 2023.
- Oregon Department of Energy, “ Renewable Portfolio Standard .” Accessed June 2, 2023.
- The Seattle Times, “ Lewis County’s Centralia bets on clean energy as coal economy fades .” Accessed June 2, 2023.
- Dakota News Now, “ Community organizations claim Mayor’s Office gutted sustainability plan .” Accessed June 2, 2023.
- E&E News, “ Montana judge refuses to cancel first U.S. climate trial .” Accessed June 2, 2023.
You’re signed up
We’ll start sending you the news you need delivered straight to you. We value your privacy. Unsubscribe easily.