Worst drivers in America
Buckle up for a wild ride in these cities
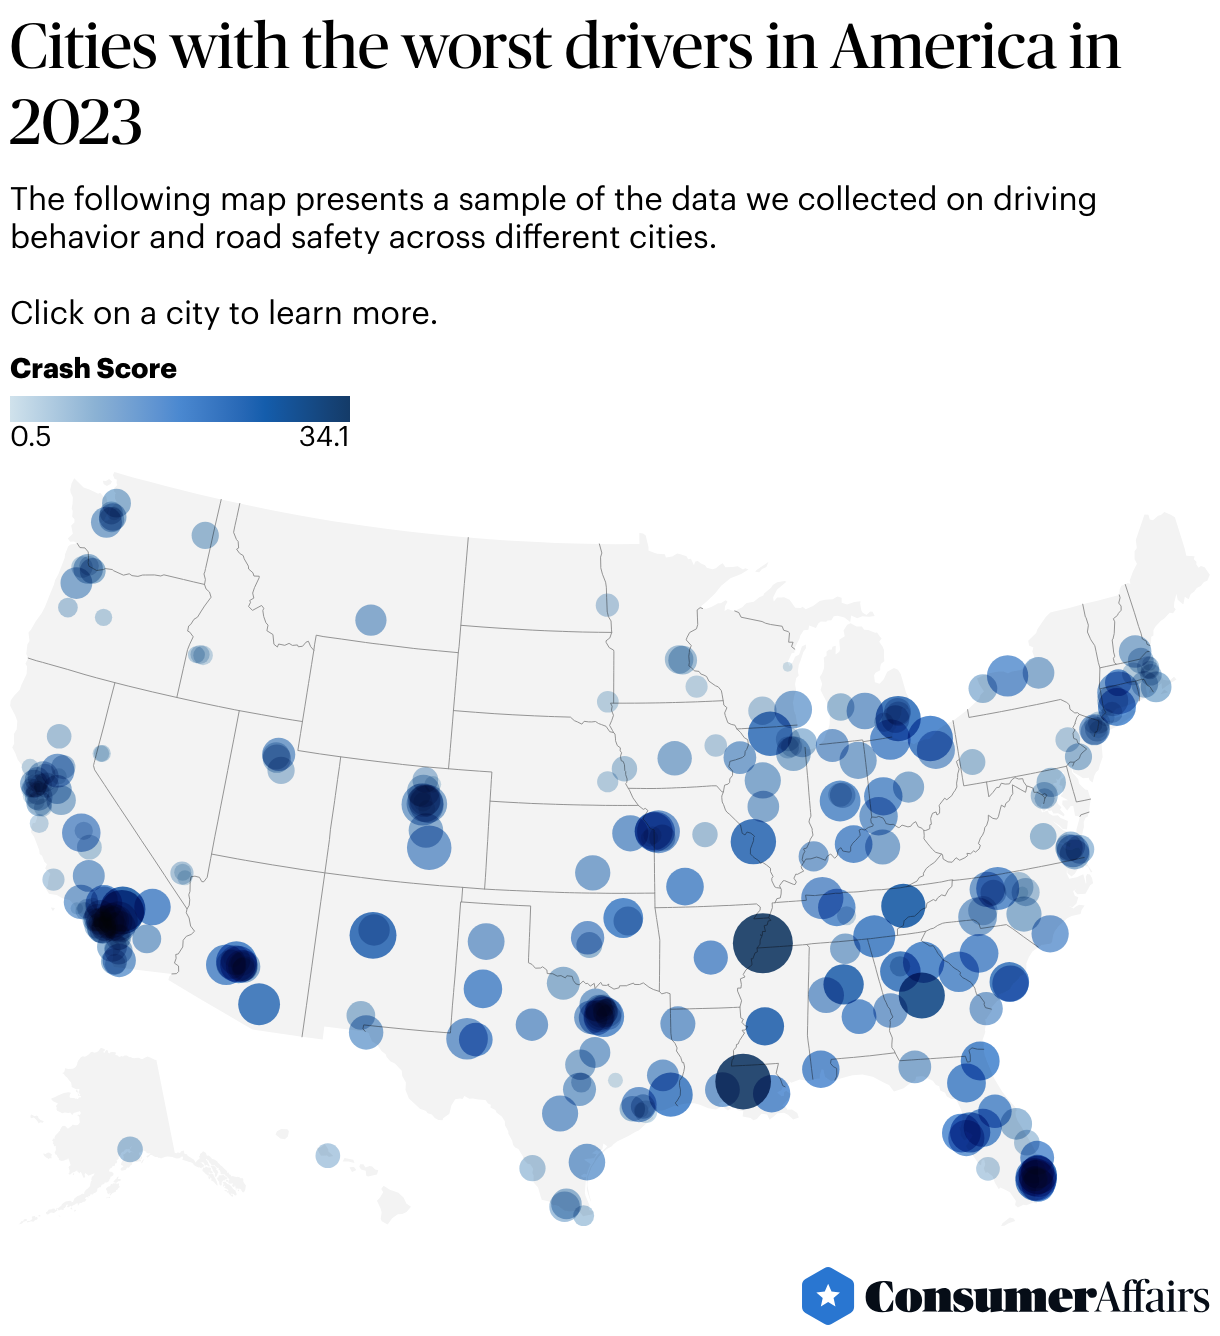
Everyone seems to think their hometown has the worst drivers. But the ConsumerAffairs Research Team took a more data-driven approach to find the ultimate breeding ground for vehicular chaos.
Key insights
- Highest rate of fatal crashes caused by bad driving: Memphis, Tennessee (5.6 times the national average)
- Highest rate of drunk-driving fatalities: Baton Rouge, Louisiana (2.2 times the national average)
- Highest rate of speeding fatalities: Hesperia, California (2.9 times the national average)
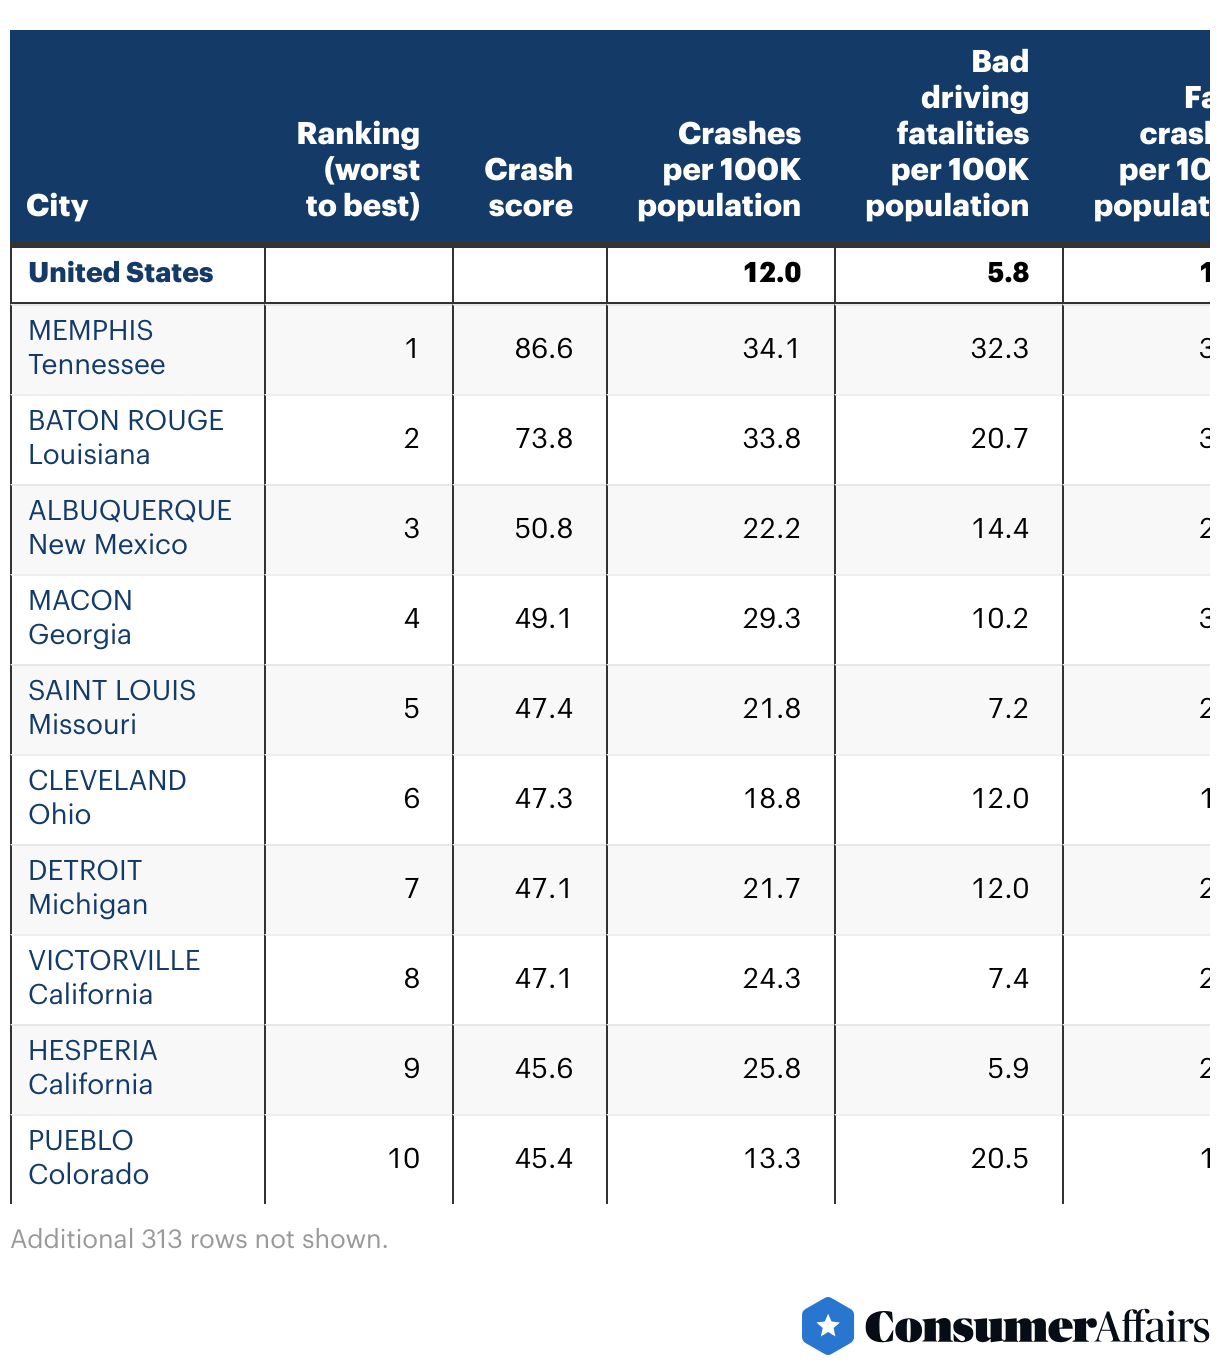
Top 5 cities with the worst drivers
In this study, we examine a range of data points from the U.S. Department of Transportation, including the number of fatal crashes, the number of fatalities caused by bad driving, the number of fatalities due to driving under the influence and the prevalence of speeding in fatal accidents, to calculate a “crash score” and rank the cities with the worst drivers.
You can see the full rankings below. Read our full methodology for all the details on how we determined the cities with the worst drivers.
» SEE FULL LIST: Does your city rank?
1. Memphis, Tennessee
Recent data from the U.S. Department of Transportation paints a sobering picture of driving conditions in Memphis. In the last recorded year (2021), bad drivers caused 203 fatal crashes in Memphis, more than any other city. (Chicago had 118, and New York City had 107.)
During the same time period, bad driving caused 19,087 fatal crashes in the U.S. This means about 1% of all fatal car crashes caused by bad driving happened on Memphis streets.
And it’s not just Memphis. Based on our analysis, several other Tennessee cities rank in the top 60 for worst drivers: Knoxville at 12th, Clarksville at 17th, Chattanooga at 19th and Nashville at 59th.
Memphis crash score: 86.6
- Fatal crashes caused by bad driving per 100K population: 32.3
- Total fatal crashes caused by bad driving: 203
- Total car crash fatalities: 238
- Total pedestrian fatalities: 55
- Fatalities due to positive BAC per 100K population: 8.8
- Percentage of fatal accidents linked to speeding: 20.1%
2. Baton Rouge, Louisiana
According to our analysis, Baton Rouge has the highest rate of fatal accidents involving drunk drivers. At a little more than 10 per 100,000, it’s more than double the national average (4.8 per 100,000).
Compared with New Orleans, which ranks 61st for worst drivers, Baton Rouge has twice the rate of fatal car crashes and almost twice the rate of total road fatalities. People are also more likely to speed and get in a fatal accident in Baton Rouge.
Some places have bad drivers, and others have bad roads — Louisiana has both. Residents across the state told us about “horrific” road conditions.
Baton Rouge crash score: 73.8
- Fatal crashes caused by bad driving per 100K population: 20.7
- Total fatal crashes caused by bad driving: 46
- Total car crash fatalities: 80
- Total pedestrian fatalities: 19
- Fatalities due to positive BAC per 100K population: 10.4
- Percentage of fatal accidents linked to speeding: 18.8%
» MORE: 2023 U.S. road conditions by state
3. Albuquerque, New Mexico
Albuquerque has a high rate of total fatal crashes, fatal crashes caused by bad driving, pedestrian fatalities and accidents that involve speeding.
New Mexico also has some of the most distracted drivers, according to data from the National Highway Traffic Safety Administration analyzed by QuoteWizard. Anecdotally, we’ve talked to several car rental and insurance customers from New Mexico who describe bad car accidents: victims of hit-and-runs, those with family members on life support and folks involved in six-vehicle collisions.
In the Land of Enchantment — and elsewhere — it might be time for tougher distracted driving laws.
Albuquerque crash score: 50.8
- Fatal crashes caused by bad driving per 100K population: 14.4
- Total fatal crashes caused by bad driving: 81
- Total car crash fatalities: 133
- Total pedestrian fatalities: 49
- Fatalities due to positive BAC per 100K population: 4.6
- Percentage of fatal accidents linked to speeding: 34.6%
4. Macon, Georgia
Macon drivers need improvement. The rate of fatal crashes caused by bad driving is about double the national average, and the rate of pedestrian fatalities is over four times the national average.
Interestingly, the data shows that fatal incidents involving speeding or alcohol are below and slightly above the national average, respectively.
Other cities in Georgia also rank in the top for worst drivers: Athens at 22nd, Atlanta at 29th and Augusta at 30th.
Macon crash score: 49.1
- Fatal crashes caused by bad driving per 100K population: 10.2
- Total fatal crashes caused by bad driving: 16
- Total car crash fatalities: 47
- Total pedestrian fatalities: 15
- Fatalities due to positive BAC per 100K population: 5.1
- Percentage of fatal accidents linked to speeding: 12.8%
5. St. Louis, Missouri
St. Louis had a lower rate of fatal crashes caused by bad driving than the four cities above, but it’s still well above the national average. Over one-third of fatal crashes are linked to speeding — more than Memphis, Baton Rouge and Macon (and almost as much as Albuquerque).
The percentage of fatal crashes involving drivers with a positive blood alcohol content also stands out. At 32.39%, that figure is the highest among the cities in the top five on our list.
Other cities in Missouri also rank in the top 60 for worst drivers: Independence at 15th, Kansas City at 34th and Springfield at 58th.
St. Louis crash score: 47.4
- Fatal crashes caused by bad driving per 100K population: 7.2
- Total fatal crashes caused by bad driving: 21
- Total car crash fatalities: 71
- Total pedestrian fatalities: 22
- Fatalities due to positive BAC per 100K population: 7.8
- Percentage of fatal accidents linked to speeding: 33.8%
Worst drivers, ranked
The following table presents a sample of the data we collected on driving behavior and road safety across different cities. Read our full methodology below to see all the ranking factors we considered to determine each city’s crash score.
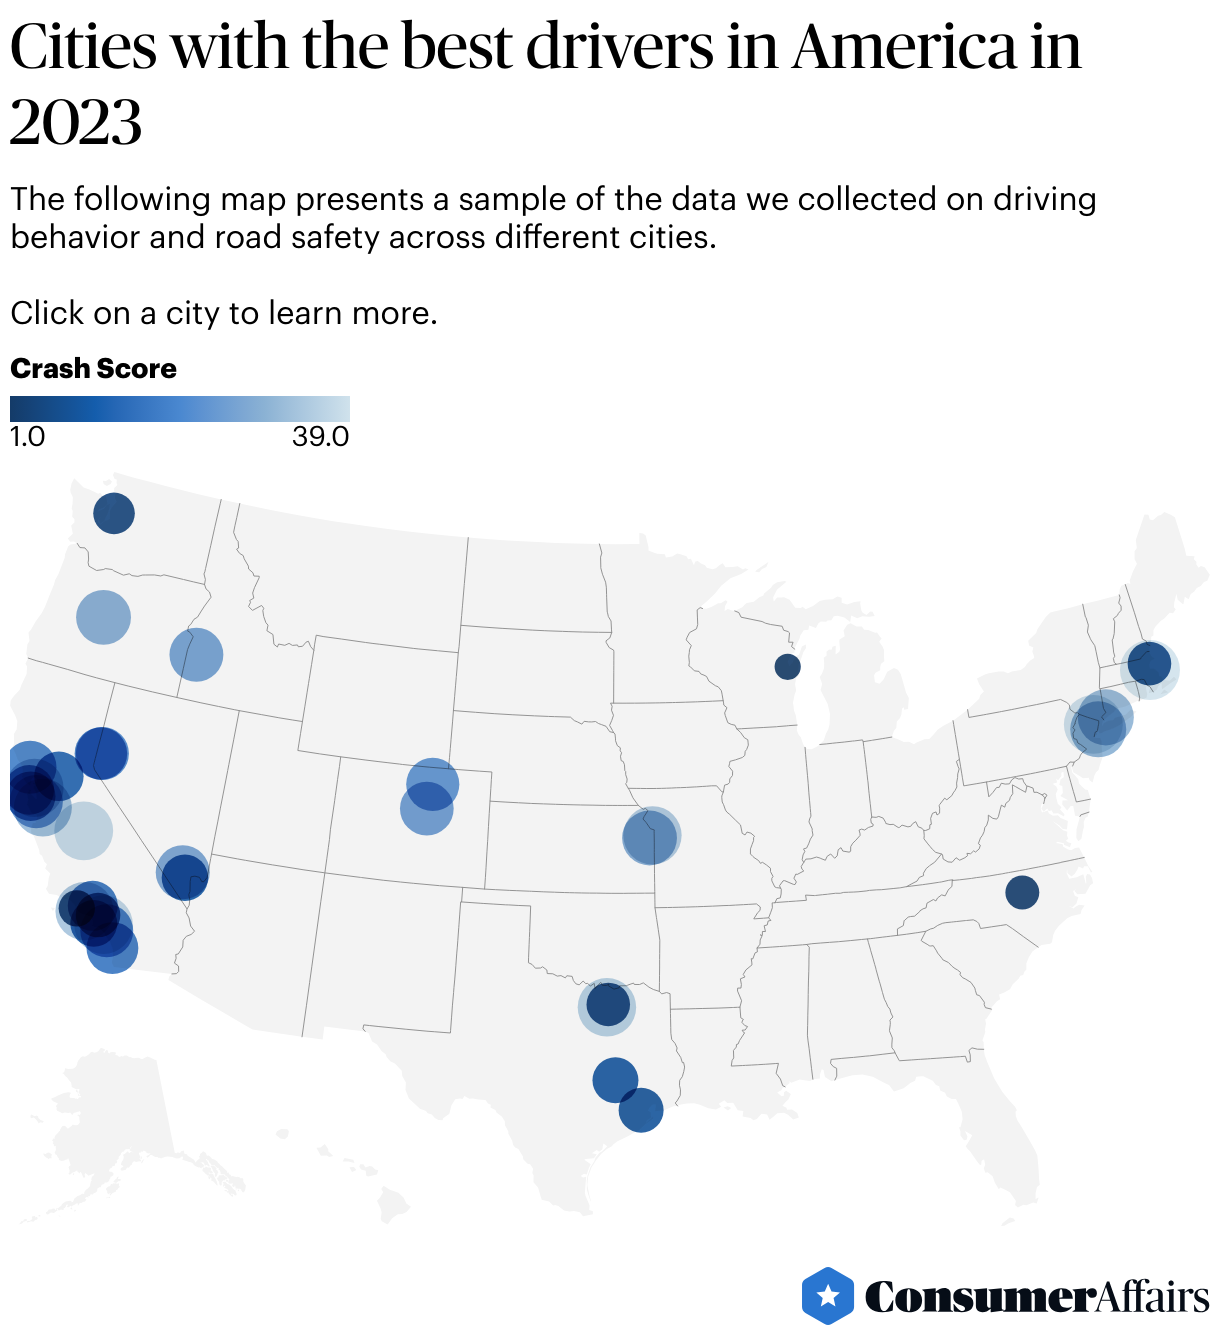
Which cities have the safest drivers?
Analyzing crash data also gave us insight into which states have the best drivers. Interestingly, Wisconsin has terrible roads but houses the city with our lowest crash score.
- Green Bay, Wisconsin
- Cary, North Carolina
- Oxnard, California
- Bellevue, Washington
- McKinney, Texas
- Lynn, Massachusetts
- Glendale, California
- Pearland, Texas
- College Station, Texas
- Henderson, Nevada
Tips for staying safe around bad drivers
No matter where you live, encountering bad drivers on the road is stressful. Here are some tips for getting home safely:
- Stay calm: Reacting impulsively or engaging in aggressive behavior can escalate the situation and increase the risk of accidents.
- Maintain a safe following distance: This gives you enough time to react to sudden maneuvers or erratic driving from other vehicles.
- Avoid aggressive driving: Resist the temptation to retaliate or engage in aggressive driving behaviors yourself. Instead, focus on defensive driving techniques.
- Always use your turn signal: Clear lane changes help prevent confusion and reduce the chances of collisions.
- Report dangerous behavior: If you see extremely reckless driving, consider reporting it to the appropriate local authorities. You'll want to get the license plate number, location and description of the vehicle.
- Avoid distractions: Don’t use your phone. Don’t brush your teeth. Don’t paint your nails. As much as possible, plan your route ahead of time so you don’t have to mess around with your GPS. Stay attentive and alert.
Bottom line
“This crisis on our roads is urgent and preventable,” Dr. Steven Cliff, then-deputy administrator of the National Highway Traffic Safety Administration, said when early estimates of 2021 data — which ConsumerAffairs used for this study — were released. The NHTSA estimated that fatalities in motor vehicle crashes that year reached a 16-year high.
Road fatalities are rising in the U.S. and exceed rates in most other high-income countries, according to the Centers for Disease Control and Prevention. As other countries embrace innovative safety measures and sustainable transportation systems, we’re still stuck in a complex web of auto-centric urban planning. Not only do Americans prioritize car ownership, but we have a transportation system designed to move us quickly — not necessarily safely.
Methodology
To determine cities with the worst drivers, the ConsumerAffairs Research Team analyzed the most recently reported crash data from the U.S. Department of Transportation (2021), including the National Highway Transportation Safety Administration’s Fatality Analysis Reporting System (FARS).
We looked at four crash factors, adding them together to create a “crash score.” These factors are:
- Total car crash fatalities per 100,000 people
- Number of fatal crashes due to bad driving per 100,000 people
- Number of fatalities due to positive blood alcohol content per 100,000 people
- Number of fatalities due to speeding per 100,000 people
Examples of “bad driving” included:
- Aggressive driving
- Careless driving
- Driving the wrong way on a one-way traffic way
- Failure to yield the right of way
- Following improperly
- Improper or erratic lane changing
- Making an improper turn
- Operating the vehicle in an erratic, reckless or negligent manner
- Operator inexperience
- Passing where prohibited
For the purposes of our rankings, we only included cities with populations of 100,000 or greater.
Article sources
- U.S. Department of Transportation, “ Workbook: DV_FARS_PD .” Accessed June 22, 2023.
- National Highway Traffic Safety Administration, “ NHTSA File Downloads .” Accessed June 22, 2023.
- QuoteWizard, “ States with the Most Distracted Drivers .” Accessed June 22, 2023.
- National Highway Traffic Safety Administration, “ Newly Released Estimates Show Traffic Fatalities Reached a 16-Year High in 2021 .” Accessed June 28, 2023.
- Centers for Disease Control and Prevention, “ Road Traffic Injuries and Deaths—A Global Problem .” Accessed June 28, 2023.
- Allstate, “ Allstate America's Best Drivers Report 2019 .” Accessed June 22, 2023.
You’re signed up
We’ll start sending you the news you need delivered straight to you. We value your privacy. Unsubscribe easily.