Most expensive cities in the U.S.
See if your city is on the list of highest housing cost
Housing costs have been rising historically fast. The Harvard Joint Center for Housing Studies reported that typical asking rents in September 2021 were up 11% over the previous year. The median sales price of U.S. homes increased even faster, rising from $322,600 in the second quarter of 2020 to $440,300 in the second quarter of 2022 (a 36.5% increase), according to data from the Federal Reserve Bank of St. Louis.
People are noticing, too — nearly half (49%) of Americans last year thought access to affordable housing was a major issue, a survey by Pew Research Center found.
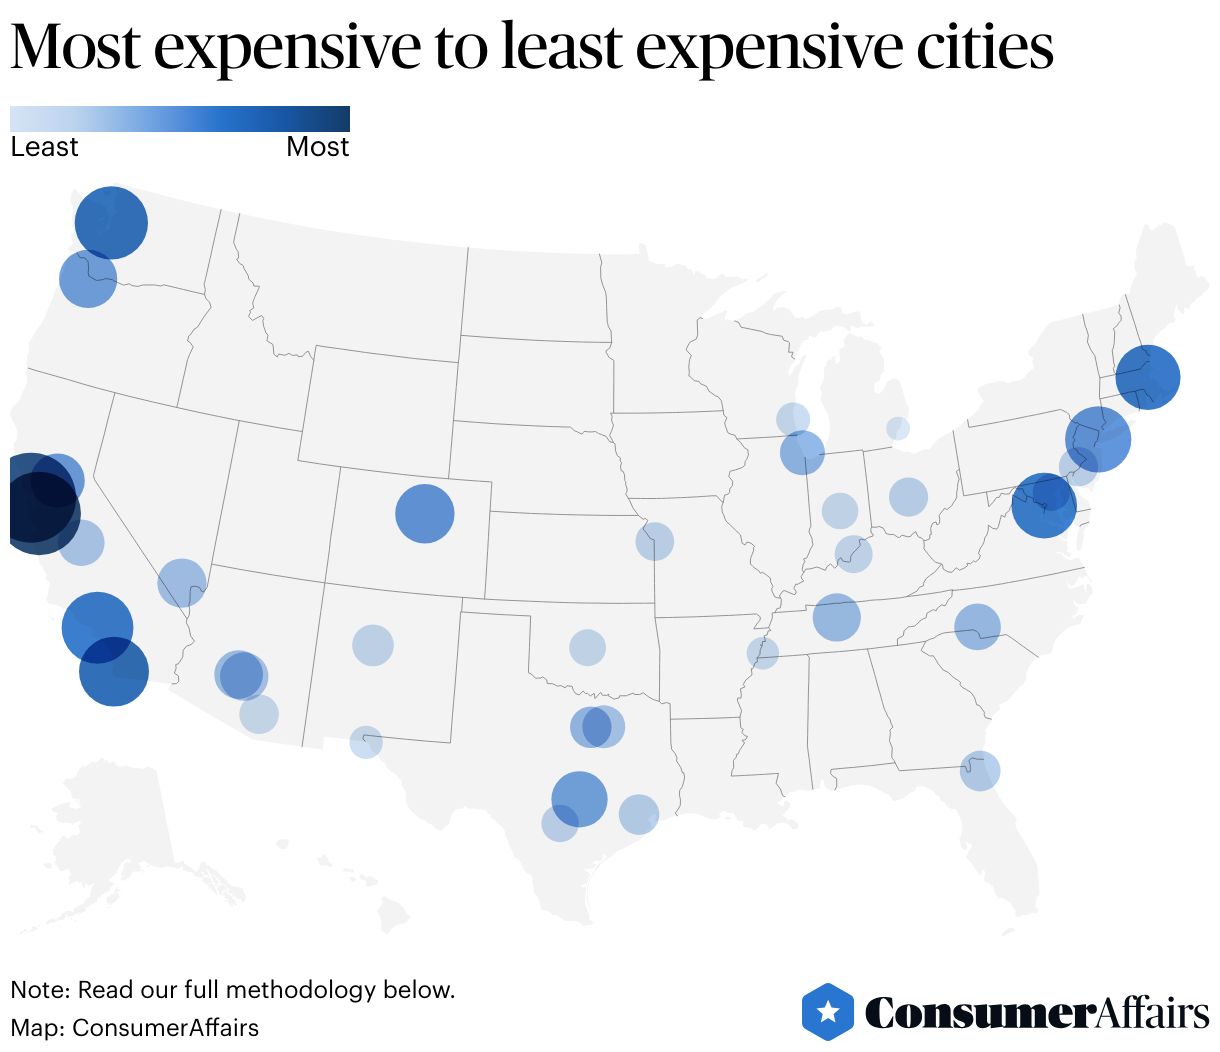
In this environment, ConsumerAffairs wanted to figure out which cities have the highest housing costs. Many other “most expensive city” rankings focus solely on the cost of buying a home. Others try to add in cost-of-living factors, like groceries and gas. Instead, using the most recent data from the U.S. Census Bureau’s American Community Survey, we ranked major U.S. cities based on how much residents spend each month on housing (whether they own or rent their homes) and how high properties are valued overall.
Key insights
- The most expensive city in the U.S. in terms of housing costs is San Jose, California. It combined the highest monthly housing costs in our study with the second-highest home values, but San Francisco wasn’t far behind. In fact, there’s a bigger gap between San Francisco (No. 2) and San Diego (No. 3) than there is between San Diego and Denver (No. 9).
- Housing costs may be affecting population growth. Each city in our top 10 saw its population shrink during the pandemic; in fact, four of them are on a U.S. Census Bureau list of the 15 cities with the fastest population declines between July 1, 2020, and July 1, 2021.
- Detroit has the most affordable housing of any large city nationwide. It had the lowest monthly costs in our analysis, and its median home value was less than half of the next-lowest city’s (El Paso).
Methodology
The 10 most expensive cities
We ranked the 37 largest U.S. cities based on 2021 single-year census estimates that covered how homeowners valued their homes and what their monthly housing costs were — including spending on mortgages, rent, real estate taxes, property insurance, utilities and other recurring housing expenses. Here are the top 10.
(We also provided info on each city’s median household income and housing costs as a percentage of income for added context.)
1. San Jose
San Francisco often rules statistical analyses of high-cost cities. Surprisingly, not this one. San Jose, California, edges out its Bay Area neighbor, with the nation’s highest median gross rent ($2,328) and highest median monthly housing costs ($2,463 per unit of housing). San Jose also has the second-highest median real estate taxes paid ($8,477) of any city in our analysis. Those data points, combined with its median home value of $1,119,500 (second only to San Francisco), make it the nation’s most expensive city for housing.
- Median monthly housing costs: $2,463
- Median household income: $126,377
- Monthly housing costs as a percentage of income: 23.39%
2. San Francisco
San Francisco, California, is a close second on our list, surpassing San Jose in median real estate taxes ($8,545) and home values ($1,306,400) but being slightly less onerous in terms of median monthly housing costs ($2,337) and gross rent ($2,167). However, this still leaves both Bay Area cities as the most expensive in our ranking by far.
- Median monthly housing costs: $2,337
- Median household income: $121,826
- Monthly housing costs as a percentage of income: 23.02%
3. San Diego
As costly as it is, San Diego, California, is a distant third on our list, thanks to a median monthly housing cost that's $419 lower than those in San Jose and a median home value more than $535,000 less than San Francisco’s. Median gross rent ($1,962) and real estate taxes paid ($5,427) are also significantly lower than what you’ll find in the two biggest cities by the Bay.
- Median monthly housing costs: $2,044
- Median household income: $93,042
- Monthly housing costs as a percentage of income: 26.36%
4. Seattle
Seattle, Washington, isn't far behind San Diego and actually surpasses it in a few measures of costliness. Median real estate taxes paid ($6,503) and owner-estimated home values ($848,100) are considerably higher in Seattle than in San Diego. However, median monthly housing costs ($1,984) are still a little lower, and median household incomes are almost $18,000 higher, giving Seattle the best median housing costs relative to median income of any city in our top 10.
- Median monthly housing costs: $1,984
- Median household income: $110,781
- Monthly housing costs as a percentage of income: 21.49%
5. Los Angeles
Los Angeles, California, comes in under Seattle in terms of median home values ($812,800) and median monthly housing costs ($1,845). However, because Los Angeles residents have a median household income almost $40,000 lower than Seattle's, LA has the highest monthly housing costs relative to income of any city in our top 10.
- Median monthly housing costs: $1,845
- Median household income: $70,372
- Monthly housing costs as a percentage of income: 31.46%
6. Boston
Boston, Massachusetts, has the highest housing costs of any East Coast city. While its median monthly housing costs ($1,883) are just a little above LA’s, its median real estate taxes paid ($4,085) are almost $1,300 lower than LA’s, and its median home value ($659,700) is over $150,000 lower.
- Median monthly housing costs: $1,883
- Median household income: $79,283
- Monthly housing costs as a percentage of income: 28.5%
7. Washington, D.C.
Housing in Washington is generally more affordable than in Boston, thanks to its lower median monthly housing costs ($1,817), real estate taxes paid ($3,699) and gross rent ($1,668). However, its median home value ($669,900) is actually slightly higher than Boston’s.
- Median monthly housing costs: $1,817
- Median household income: $90,088
- Monthly housing costs as a percentage of income: 24.2%
8. New York
New York City was a distant No. 8 in our scoring. It has median monthly housing costs ($1,632) almost $200 lower than those in Washington, D.C., despite its median for real estate taxes paid ($5,910) being more than $2,200 higher than those in Washington. Also, while New York is lower than Washington in our ranking, it’s worth pointing out that the median household income in New York is over $22,000 less, meaning that New York has a greater proportion of median household income going to housing than any city in our top 10 but Los Angeles.
- Median monthly housing costs: $1,632
- Median household income: $67,997
- Monthly housing costs as a percentage of income: 28.8%
9. Denver
The median monthly housing costs ($1,626) and gross rent ($1,549) in Denver, Colorado, are close to New York’s, but Denver is cheaper in a few other measurements we looked at. Denver’s median home value ($541,500) is over $144,000 lower than New York’s, and its median for real estate taxes paid ($2,383) is less than half of New York’s exceptionally high median tax bill.
- Median monthly housing costs: $1,626
- Median household income: $81,630
- Monthly housing costs as a percentage of income: 23.9%
10. Portland
Portland, Oregon, residents pay considerably more in real estate taxes than people in Denver, according to its median $4,873 tax bill, but housing in Portland still winds up being more affordable overall thanks to its lower median monthly housing costs ($1,535), owner-occupied unit values ($520,200) and gross rent ($1,394).
- Median monthly housing costs: $1,535
- Median household income: $79,057
- Monthly housing costs as a percentage of income: 23.3%
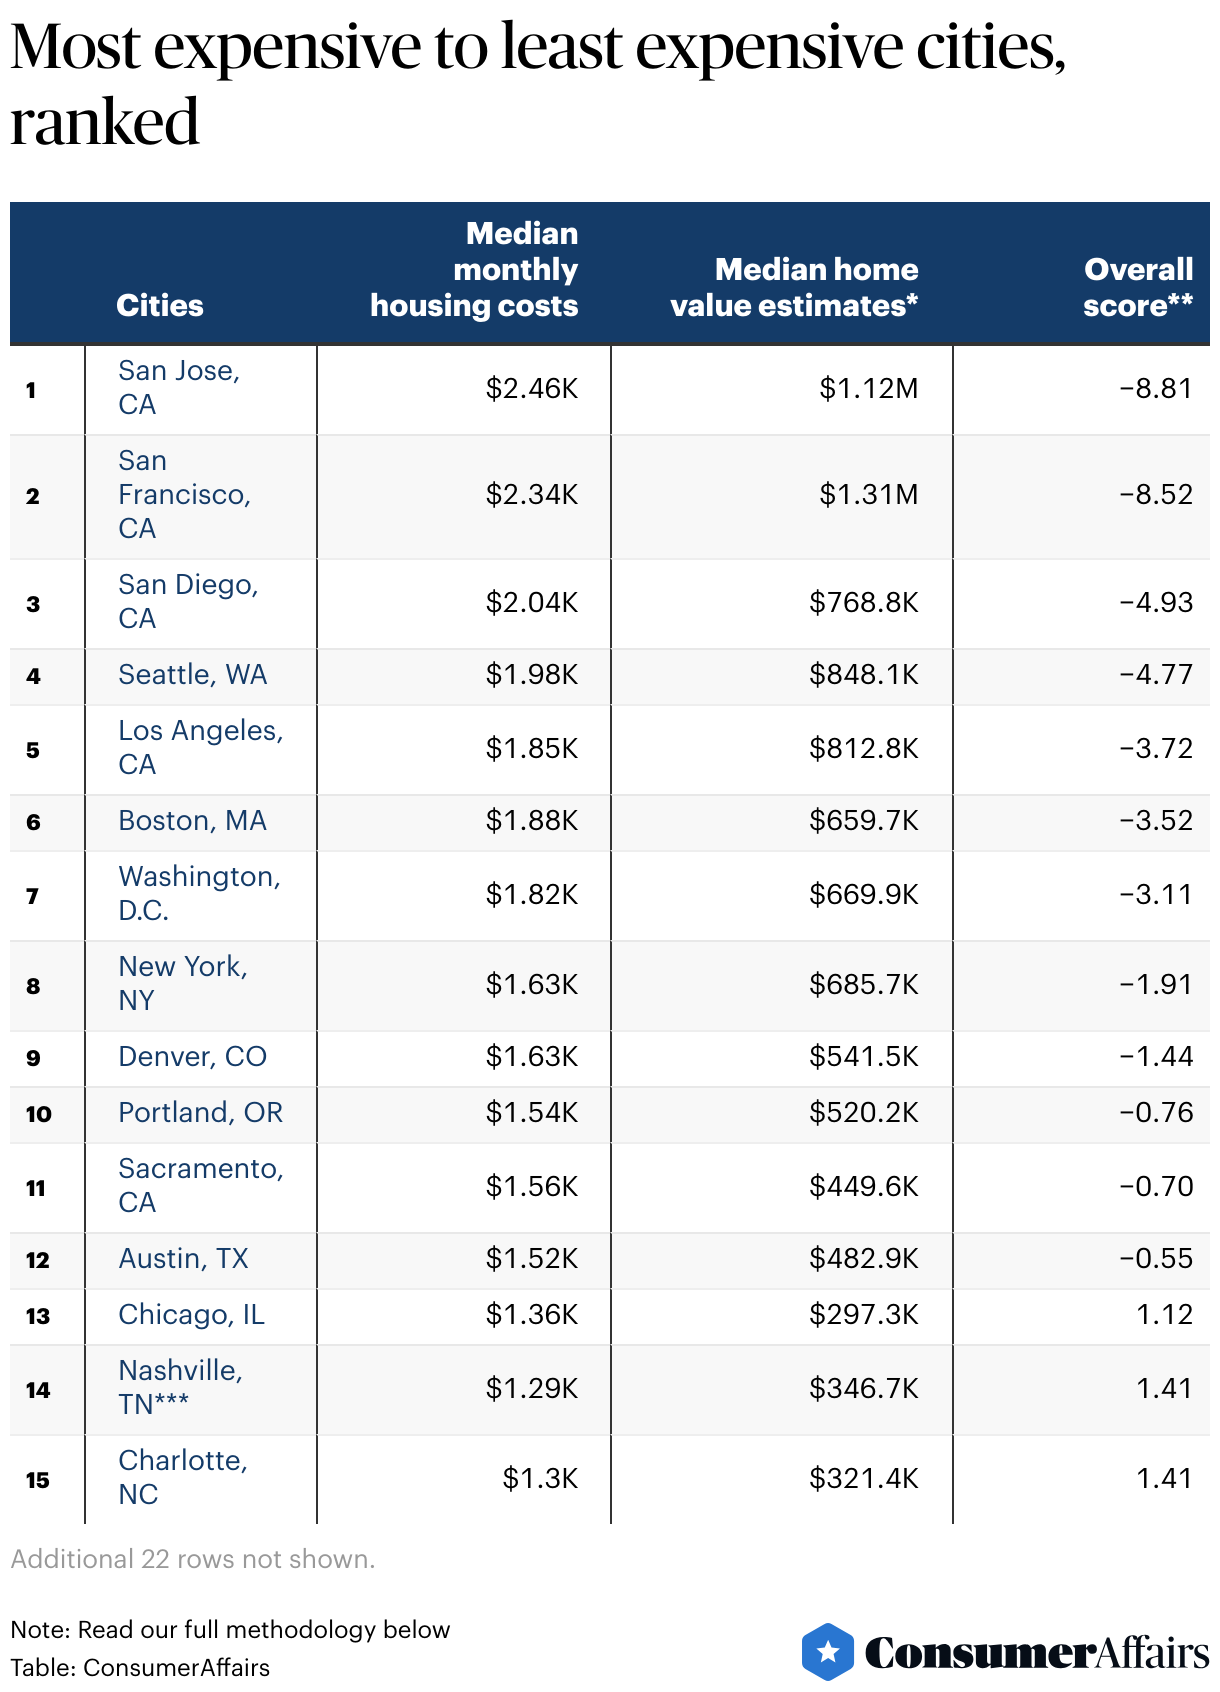
*Median value of owner-occupied units. **Overall scores are based on a scale where cities more expensive than average have negative scores, while more affordable cities have positive scores. Scores may be rounded or shortened. ***Data for these consolidated cities is based on the city “balance,” which is the city without any of the semi-independent incorporated places within its limits.
Are people being priced out of the most expensive cities?
Given increases in housing costs over the last few years, housing affordability has become a legitimate concern for people in many cities, with some residents wondering if they can financially handle living in the cities they already call home.
Maybe not coincidentally — each of the top 10 most expensive cities in our ranking experienced population losses at some point in the last few years. When the U.S. Census Bureau ranked the 15 cities with the fastest population declines one year into the coronavirus pandemic, four of our top 10 most expensive cities made their list. (And other communities in their metropolitan areas took up 10 more of the top 15 spots.)
In total, 14 of the 15 fastest-declining town or city populations in the U.S. were in or around the 10 most expensive cities for housing.
The Census Bureau actually added a question to the 2021 American Community Survey to gauge how many people were planning to move in the next 12 months. Unfortunately, results aren’t available for every city nationwide, but the numbers the Census Bureau has published can tell us something about how likely people are to leave expensive areas.
Based on this new data, Seattle and Dallas metro residents were tied for first place as the most likely to report intentions to leave their cities for somewhere else. The San Jose metro population came in third place. That means two of our top four most expensive cities also have metro populations that are among the nation’s most motivated to relocate.
14 of the 15 fastest-declining town or city populations in the U.S. were in or around the 10 most expensive cities for housing.”
However, housing costs don’t always predict how likely residents are to plan a move somewhere else. New York City metro residents had little intention to leave despite the area’s high housing costs, and Detroit (the most affordable city in our ranking of housing costs) had metro residents that were more motivated to leave than those in half of the other areas we had data for.
Here’s the full list of every metropolitan area the Census provided this data for, ranked from most likely to least likely to have residents planning to leave:
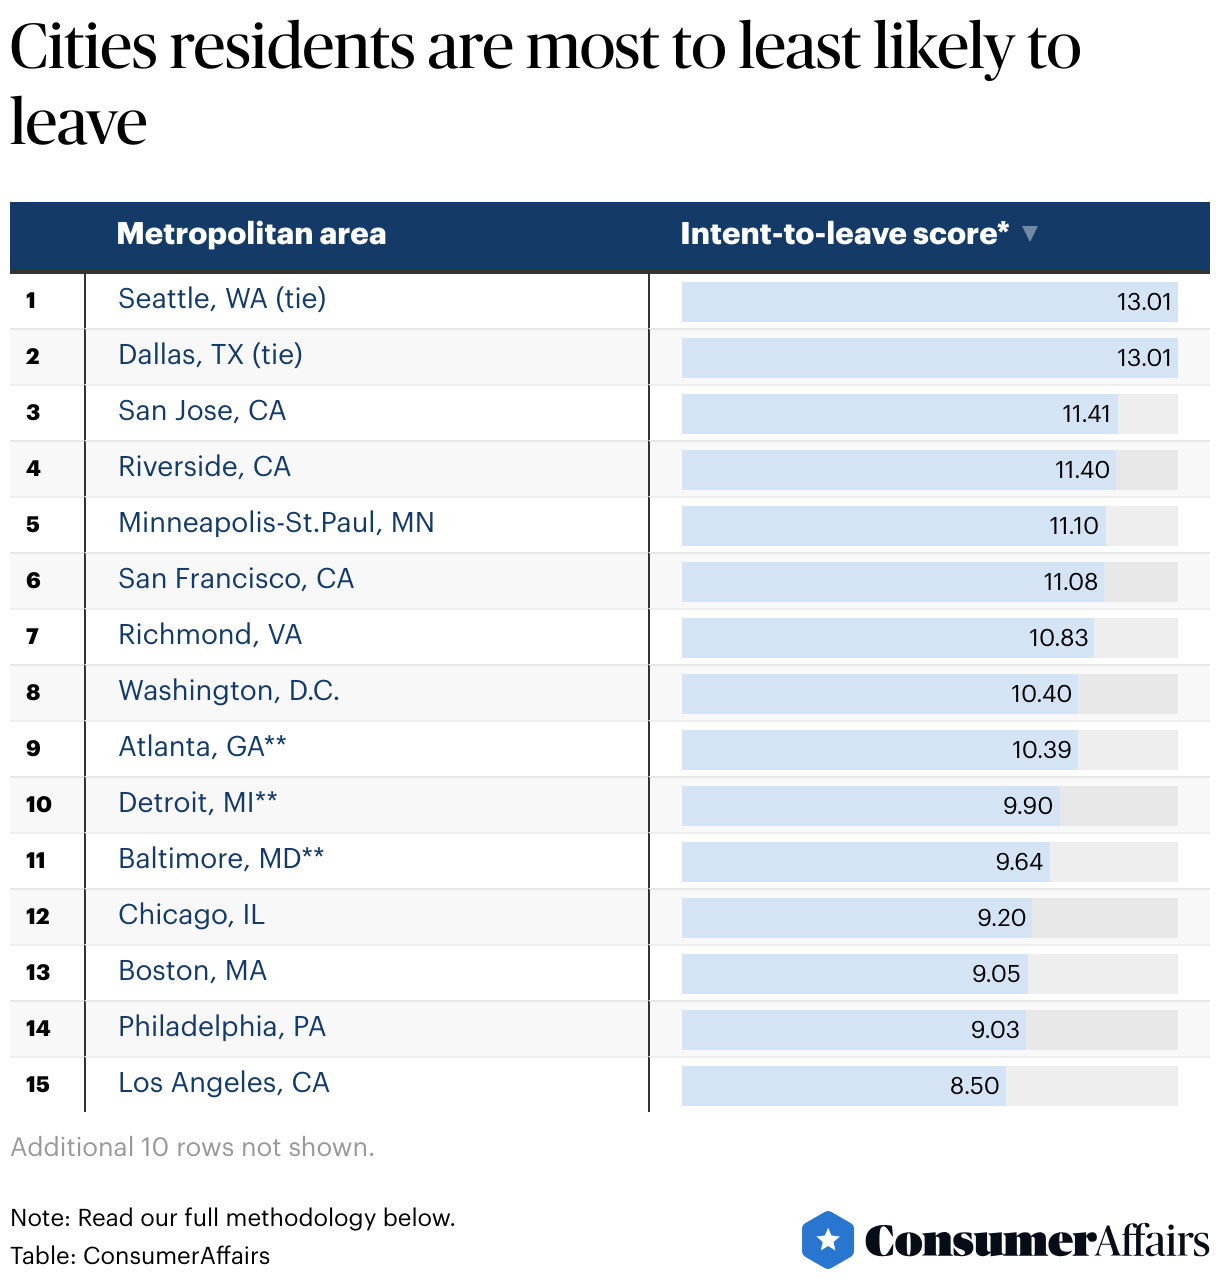
*We calculated an “intent-to-leave score” based on the number of residents who responded that they planned or thought about moving somewhere else divided by the number of residents who said they either had no plans to move or planned to move within their metropolitan area. Results were then multiplied by 100 and rounded.
**These cities had incomplete data for people who planned to move to different residences in their existing neighborhoods.
It’s worth pointing out that correlation does not equal causation, though. Factors other than housing costs (like the pandemic, the increasing popularity of remote work and other costs of living) may also be behind these population shifts. All told, it’s unlikely that housing costs are the only factor driving people away from expensive cities; however, they may play a part in why many large cities are losing residents faster than they can attract new people.
Methodology
ConsumerAffairs used data from the U.S. Census Bureau’s American Community Survey (ACS) to determine the most expensive cities nationwide. Our rankings were based on two measurements provided by the ACS: “median monthly housing costs” and “median owner-occupied unit values.”
The median monthly housing costs for each city come from a formula developed by the Census Bureau to account for how much residents spent on the following:
- Rent
- Payments toward mortgages, deeds of trust, contracts to purchase or similar debts
- Real estate taxes
- Fire, hazard and flood insurance
- Utilities (electricity, gas and water/sewer)
- Fuels (oil, coal, kerosene, wood, etc.)
- Condominium fees
- Mobile home costs (personal property taxes, site rent, registration fees and license fees)
Median owner-occupied unit values are estimates from the owner or co-owner of the home regarding how much their properties would sell for if they were put up for sale.
We started our analysis with the 37 U.S. cities that had more than 500,000 residents, according to the ACS. All statistics used in this analysis were taken from 2021 ACS one-year estimates.
Individual scores for the two factors we analyzed are calculated in terms of a z-score. This involves subtracting each statistic from the weighted 37-city average, then dividing it by the standard deviation of all 37 cities’ statistics for that factor. Therefore, each single-factor score represents how many standard deviations away from the average a given city’s statistic is.
These z-scores are then clipped from -3 to 3 and weighted so that monthly housing costs count three times as much as property values. Finally, the weighted scores are added together for each city’s overall score, which is scaled to range from -10 to 10. A negative overall score indicates a more expensive city, and a positive overall score indicates a less expensive city.
Article sources
- Harvard Joint Center for Housing Studies, “ RENTS HAVE SOARED ACROSS THE COUNTRY, BUT HOME PRICES GREW EVEN FASTER .” Accessed July 27, 2022.
- Federal Reserve Bank of St. Louis, “ Median Sales Price of Houses Sold for the United States .” Accessed July 20, 2022.
- The White House, “ Housing Prices and Inflation .” Accessed July 19, 2022.
- Pew Research Center, “ Key facts about housing affordability in the U.S. ” Accessed July 19, 2022.
- U.S. Census Bureau, “ New Data Reveal Most Populous Cities Experienced Some of the Largest Decreases .” Accessed August 4, 2022.
- U.S. Census Bureau, “ Explore Census Data .” Accessed July 18, 2022.
- U.S. Census Bureau, “ American Community Survey and Puerto Rico Community Survey: 2021 Subject Definitions .” Accessed Oct. 14, 2022.
- U.S. Census Bureau, “ Median Value of Owner-Occupied Housing Units .” Accessed July 27, 2022.
- U.S. Census Bureau, “ American Housing Survey (AHS) Table Creator .” Accessed Oct. 14, 2022.
You’re signed up
We’ll start sending you the news you need delivered straight to you. We value your privacy. Unsubscribe easily.